Rainfall frequency analysis
Turn rain gauge records into defensible IDF curves.
Cascade Hydro fits extreme-value distributions, screens outliers to Bulletin 17B, imports ECCC station data, and exports publication-ready intensity–duration–frequency tables. On your desktop, offline.
How it works
Three steps from record to curve
The same path the analysis takes: a raw precipitation record becomes a fitted distribution, then a family of IDF curves.
Import
Pull an ECCC station over the air, drop in a CSV or Excel record, or estimate from coordinates when there's no gauge on site.
Screen & fit
Completeness and Bulletin 17B outlier screening, then Gumbel or GEV extreme-value fitting with goodness-of-fit reporting.
Curves & export
Read IDF/DDF curves and design storms, then export publication-ready tables to CSV or Excel.
Capabilities
A closer look at every step
One workspace for the whole frequency analysis, with every method and citation surfaced as you work.

Sample resolved ratios — sub-daily depth as a fraction of the 24-hour depth
| Location | Basis | 5 min | 15 min | 1 h | 6 h | 12 h | 24 h |
|---|---|---|---|---|---|---|---|
| Vancouver, BC | Ecozone median | 0.060 | 0.100 | 0.170 | 0.470 | 0.700 | 1.000 |
| Halifax, NS | Nearest gauges | 0.072 | 0.114 | 0.233 | 0.571 | 0.732 | 1.000 |
| Calgary, AB | Nearest gauges | 0.144 | 0.263 | 0.405 | 0.626 | 0.795 | 1.000 |
| Winnipeg, MB | Nearest gauges | 0.181 | 0.323 | 0.534 | 0.783 | 0.896 | 1.000 |
| Toronto, ON | Nearest gauges | 0.204 | 0.372 | 0.608 | 0.849 | 0.922 | 1.000 |
Coastal Pacific storms spread rain over long durations, so their short-duration ratios are low; interior and Great Lakes convective storms concentrate it, so theirs are high. Each value is resolved at the location from the surrounding gauge network.
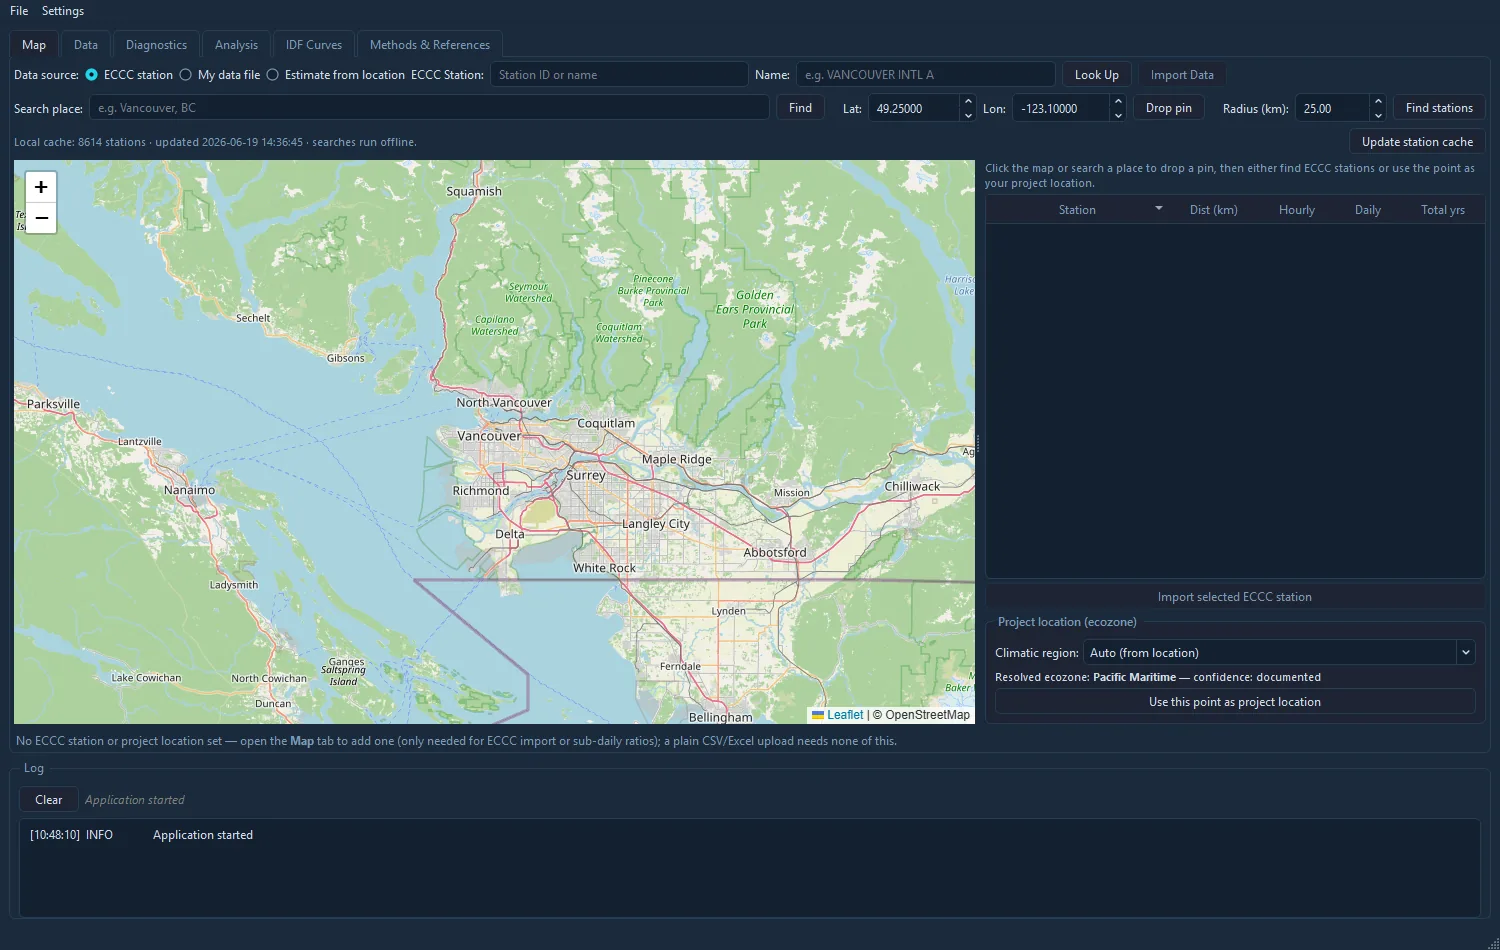
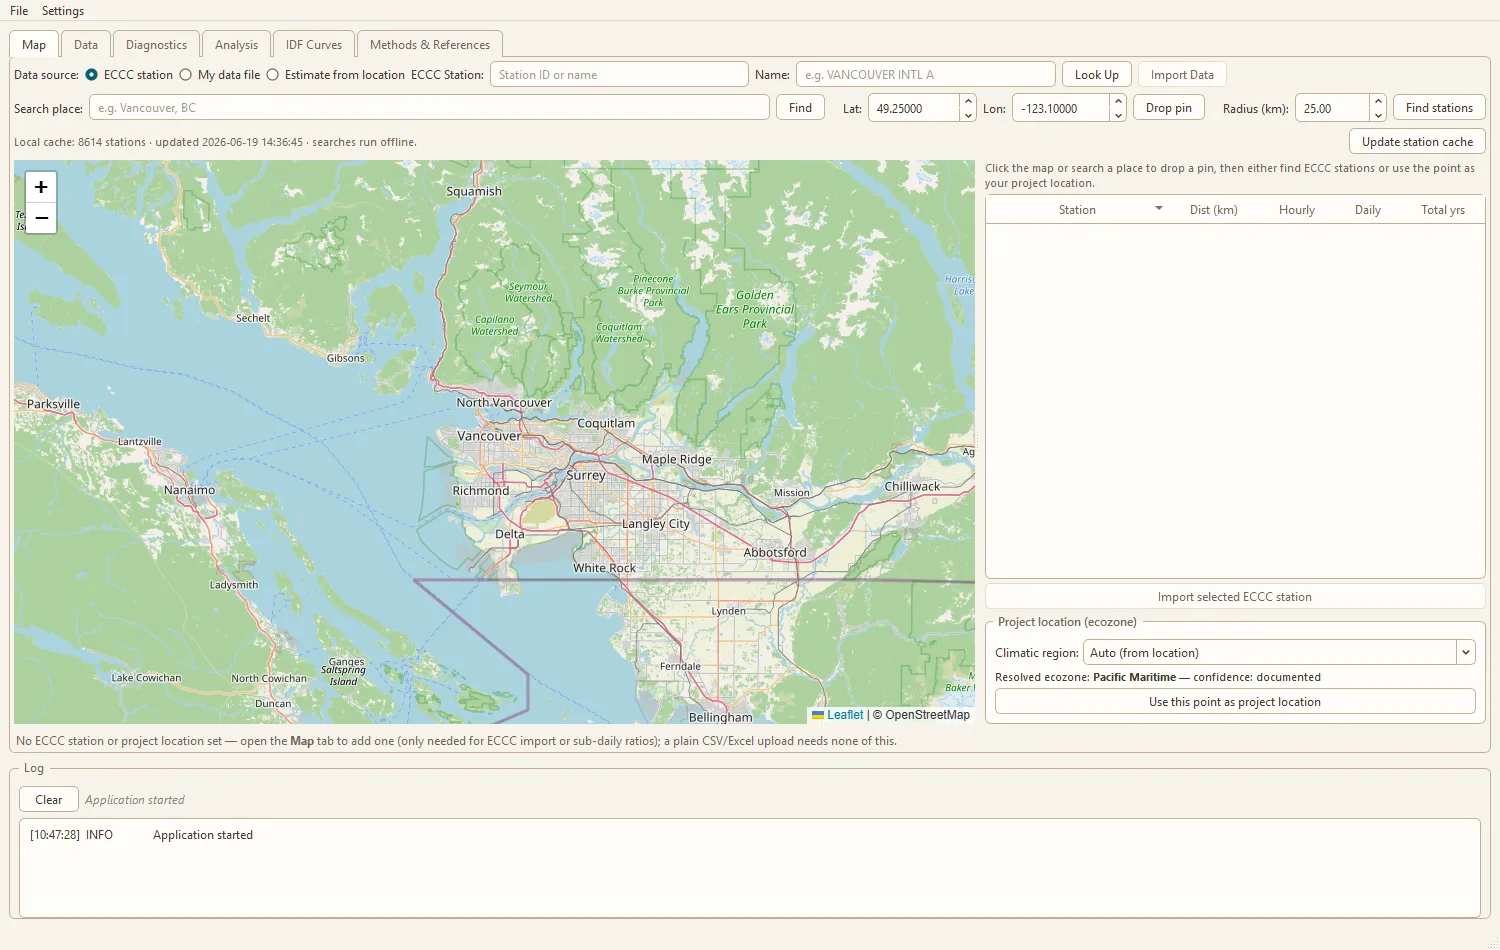
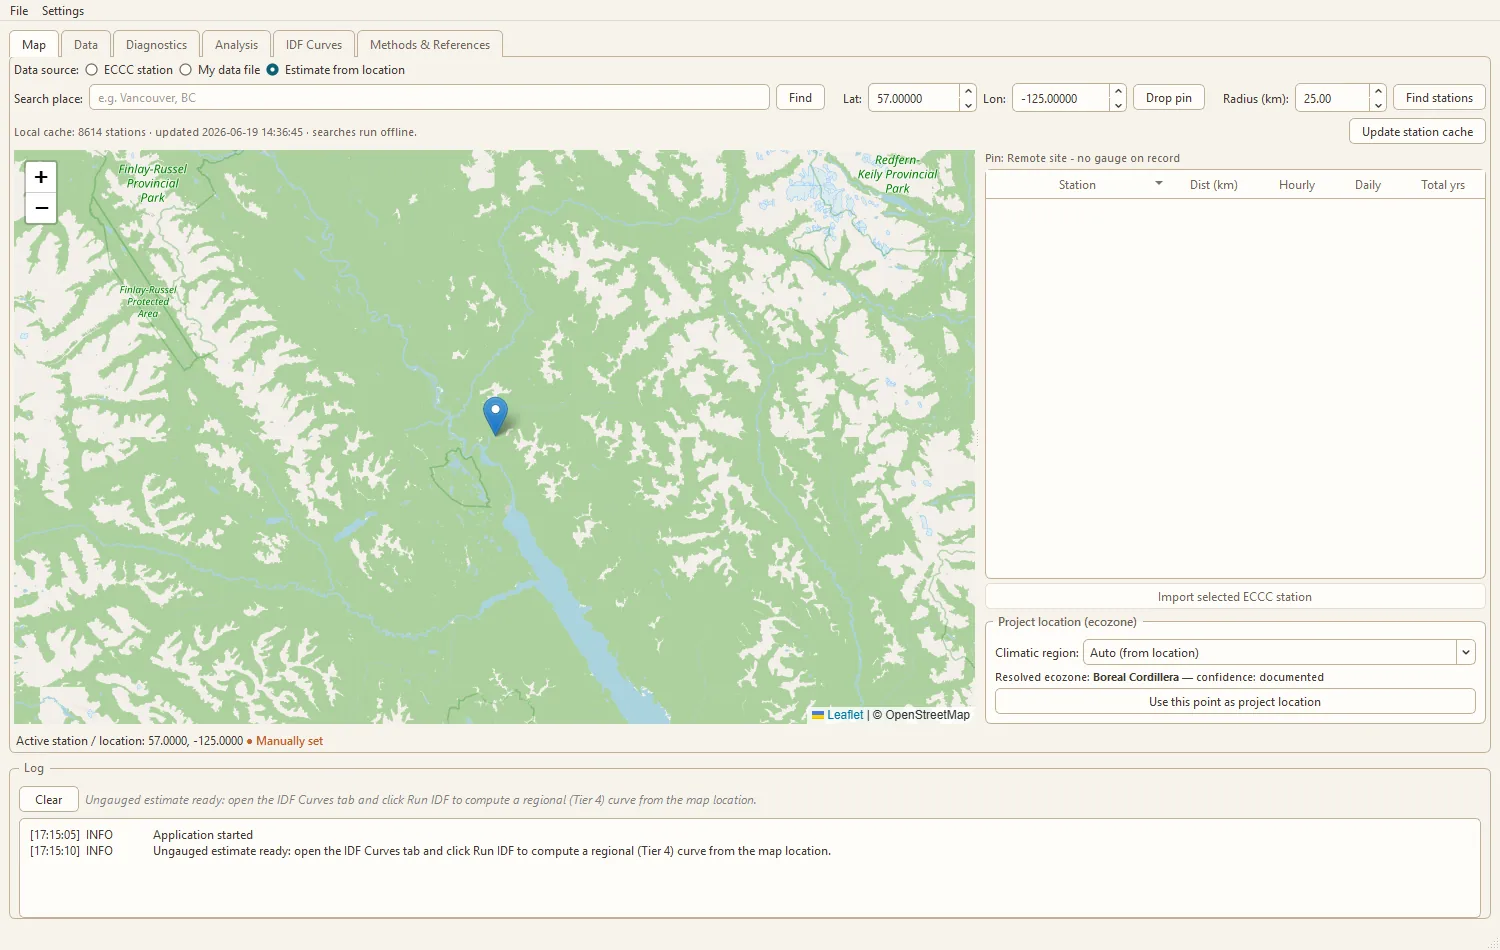
Station import
Pull Environment and Climate Change Canada station records directly over the GeoMet service, or drop a pin to set a project location and ecozone. Ready to analyse in one step, no manual download.
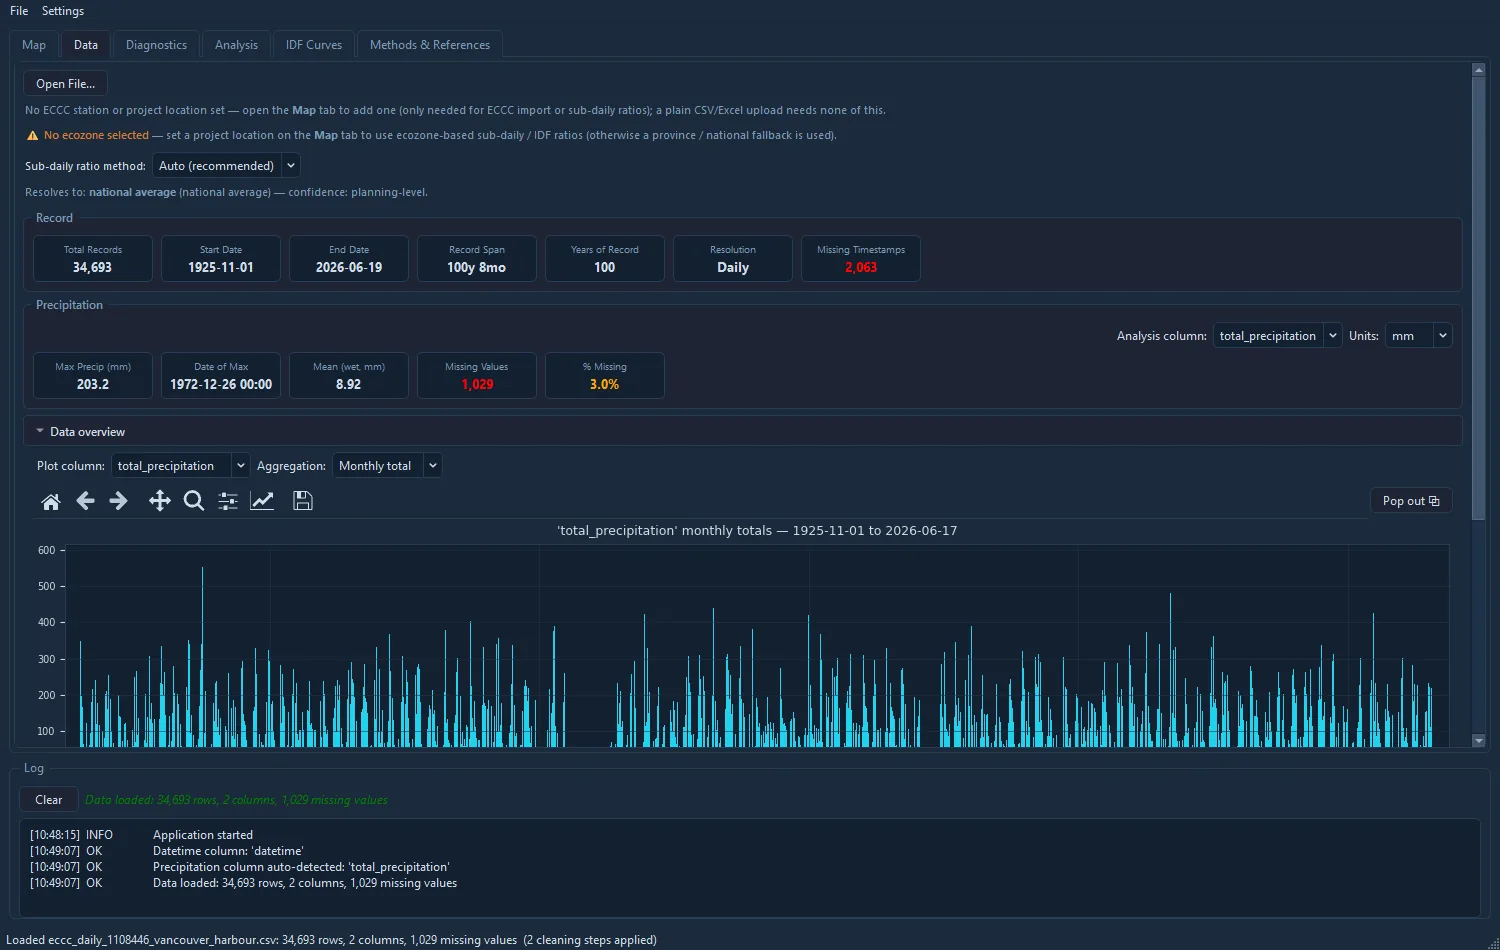
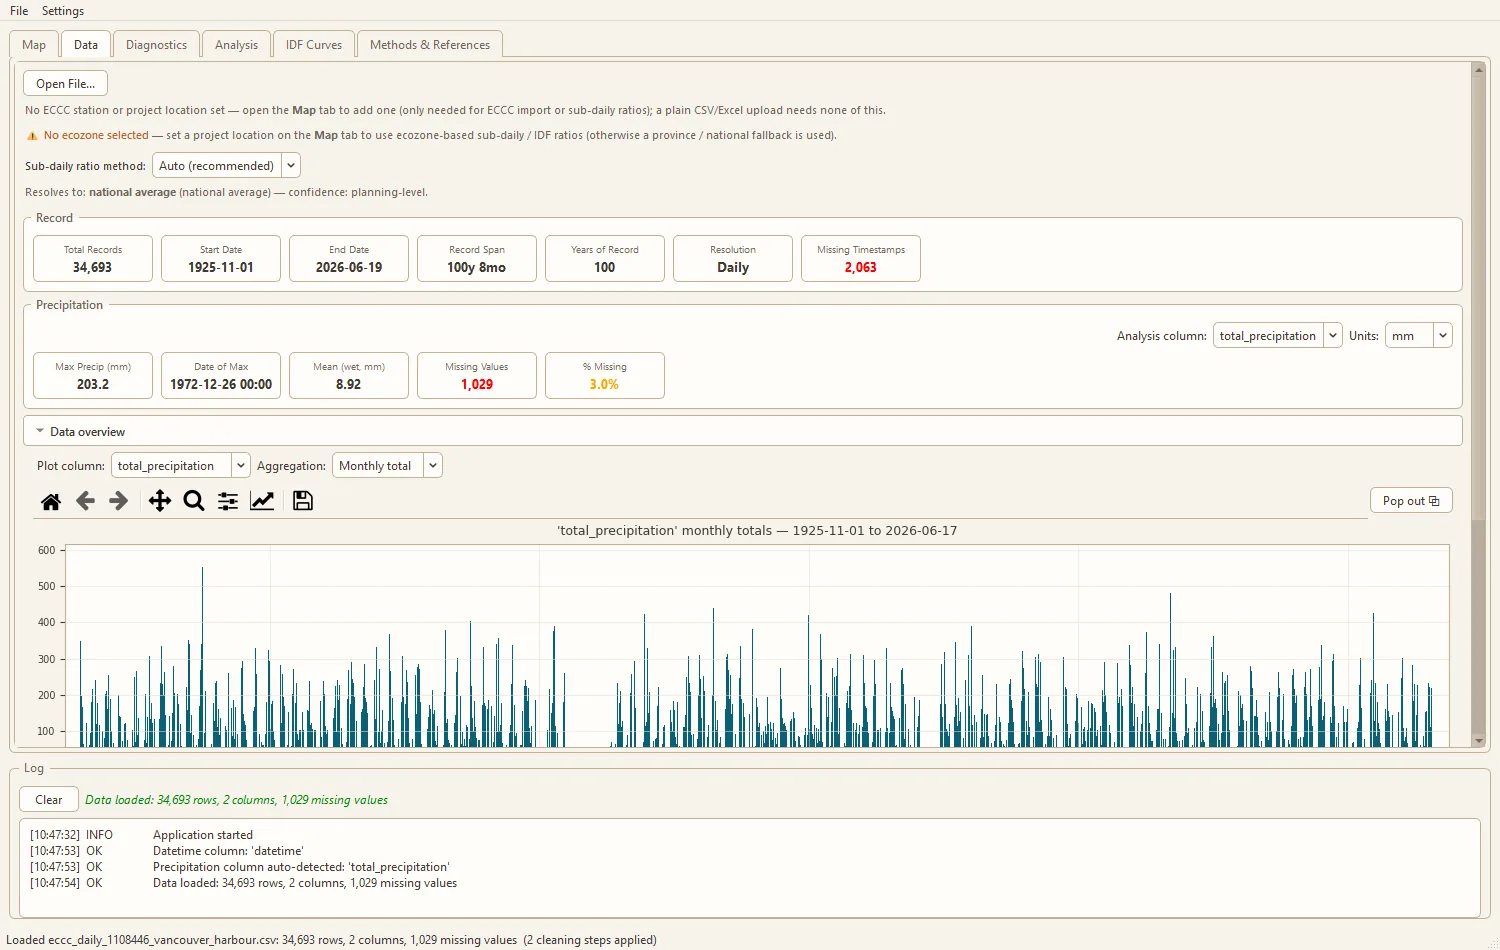
Your data, at a glance
Load a CSV or Excel record offline. Cascade Hydro summarizes completeness, span, and seasonality, plots an overview, and echoes the resolved location and ecozone so you can confirm what you are about to analyse.
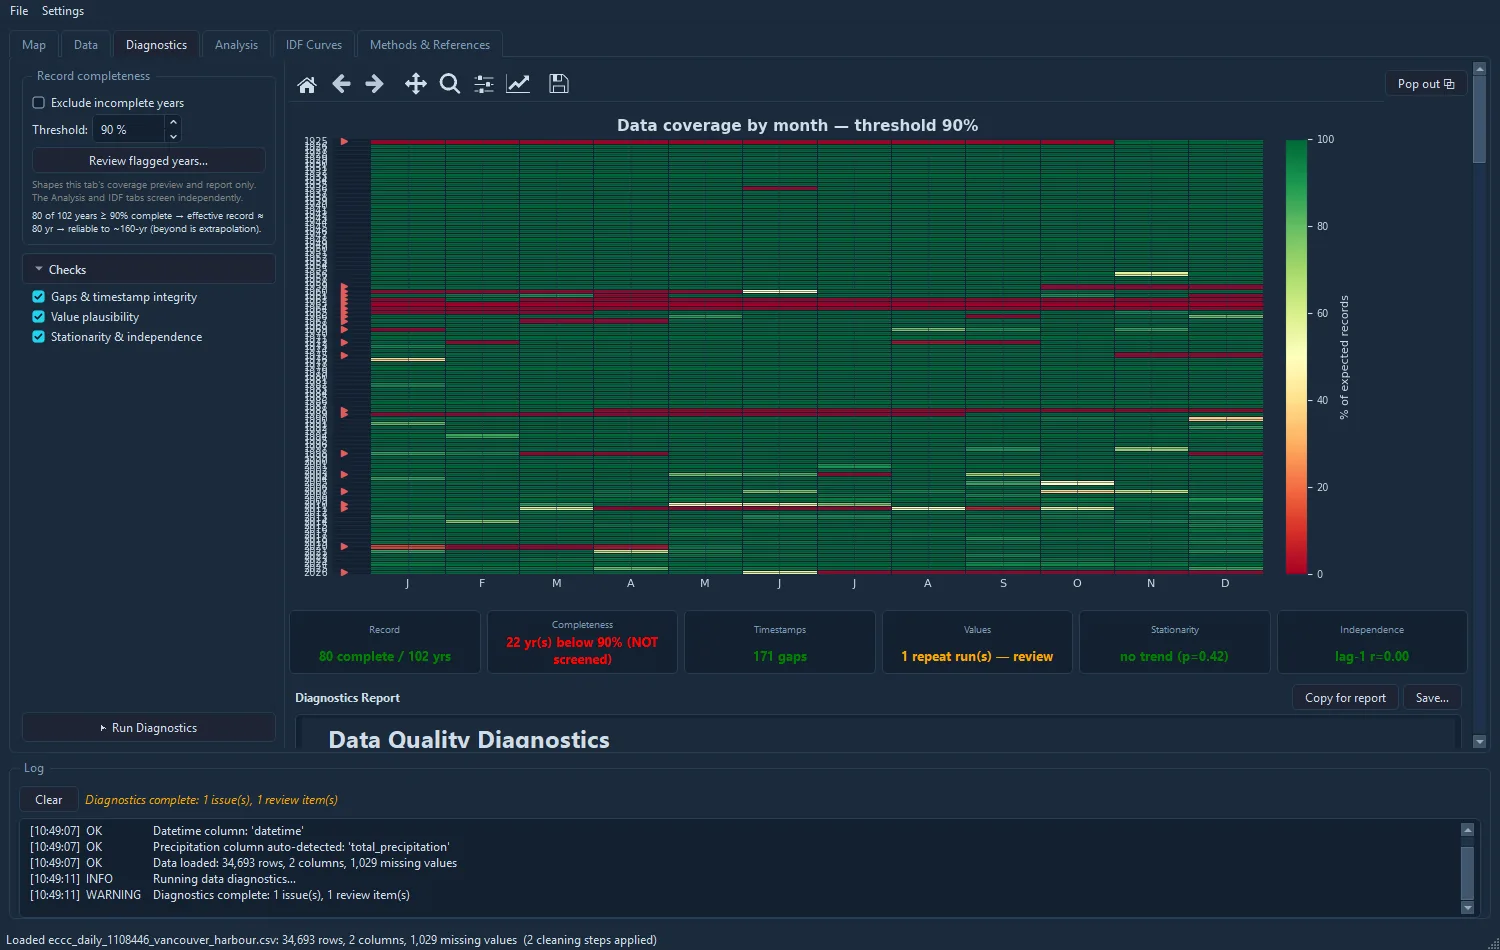
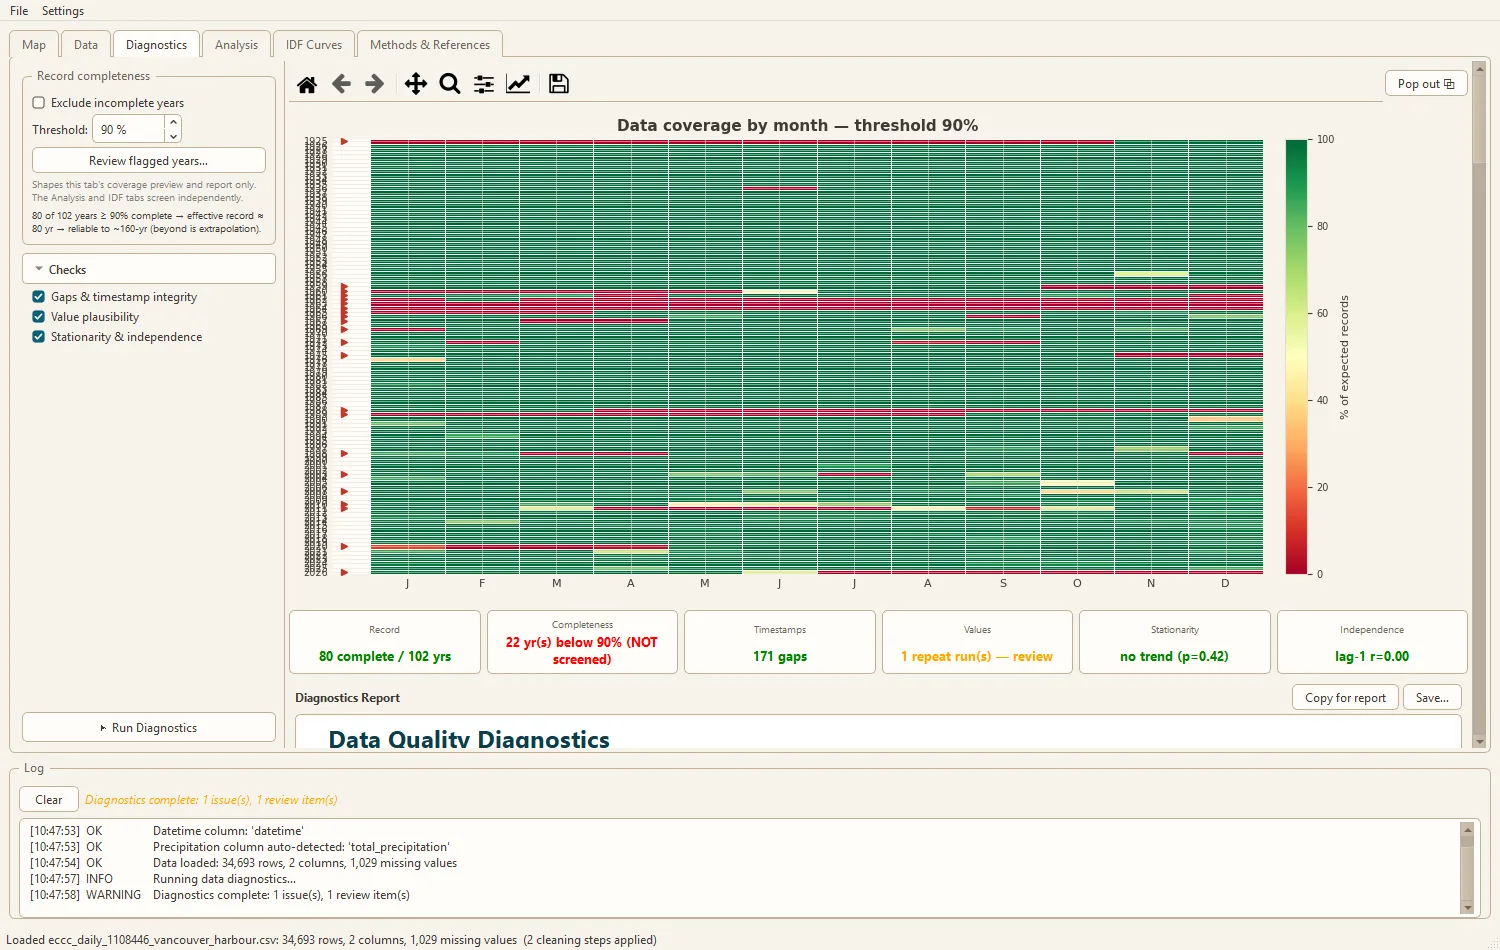
Outlier & completeness screening
Grubbs and modified-Z outlier tests following USGS Bulletin 17B/17C, with completeness and record-adequacy checks on every series. Flagged years are shown, not silently dropped.
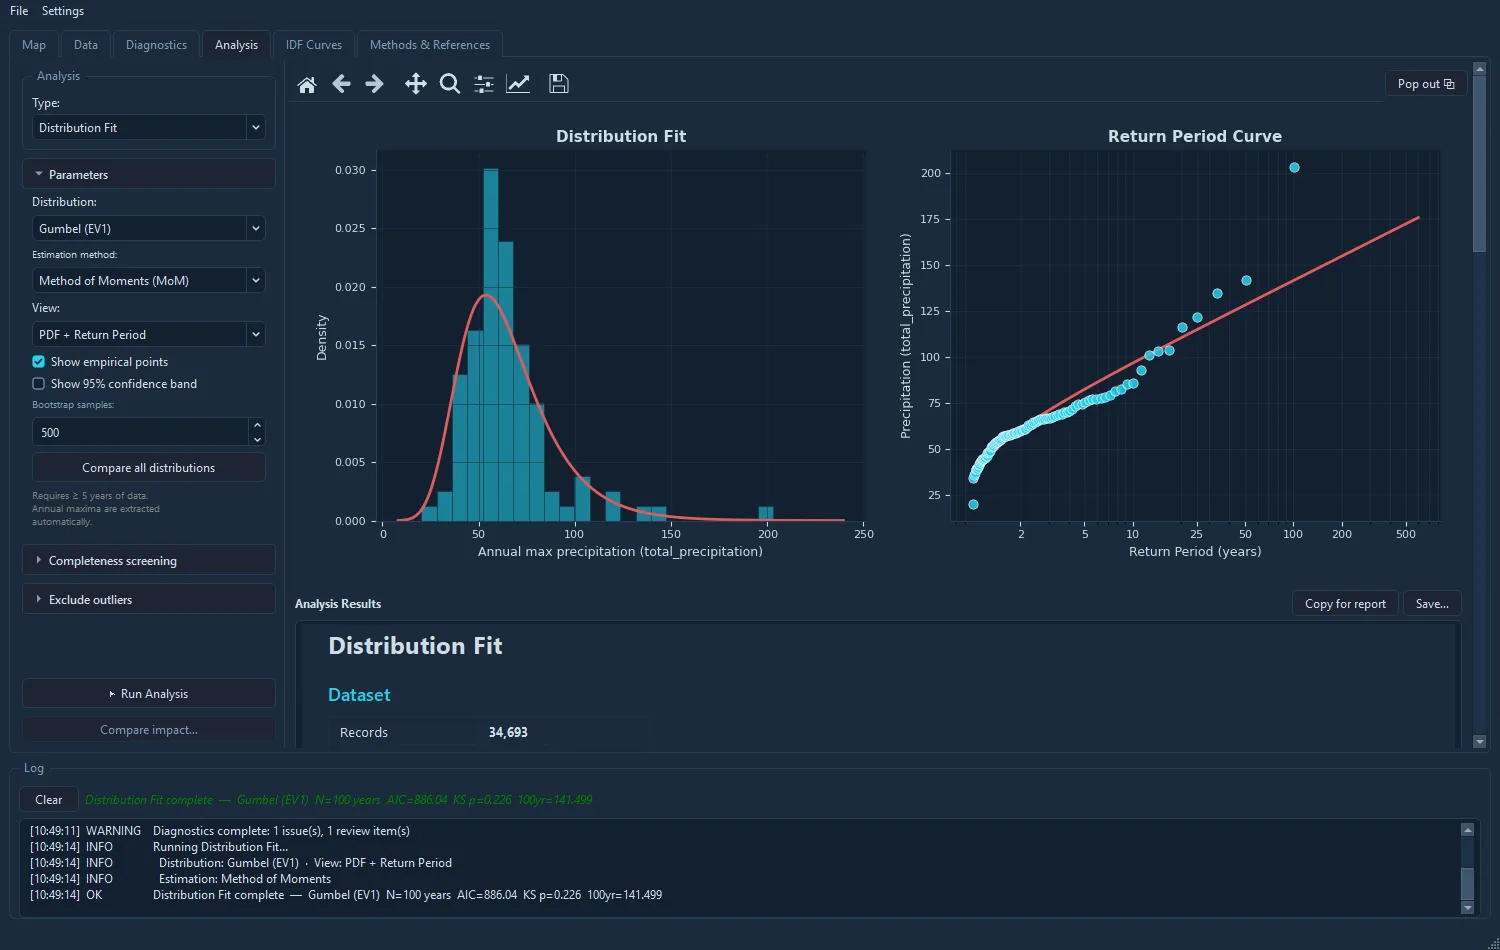
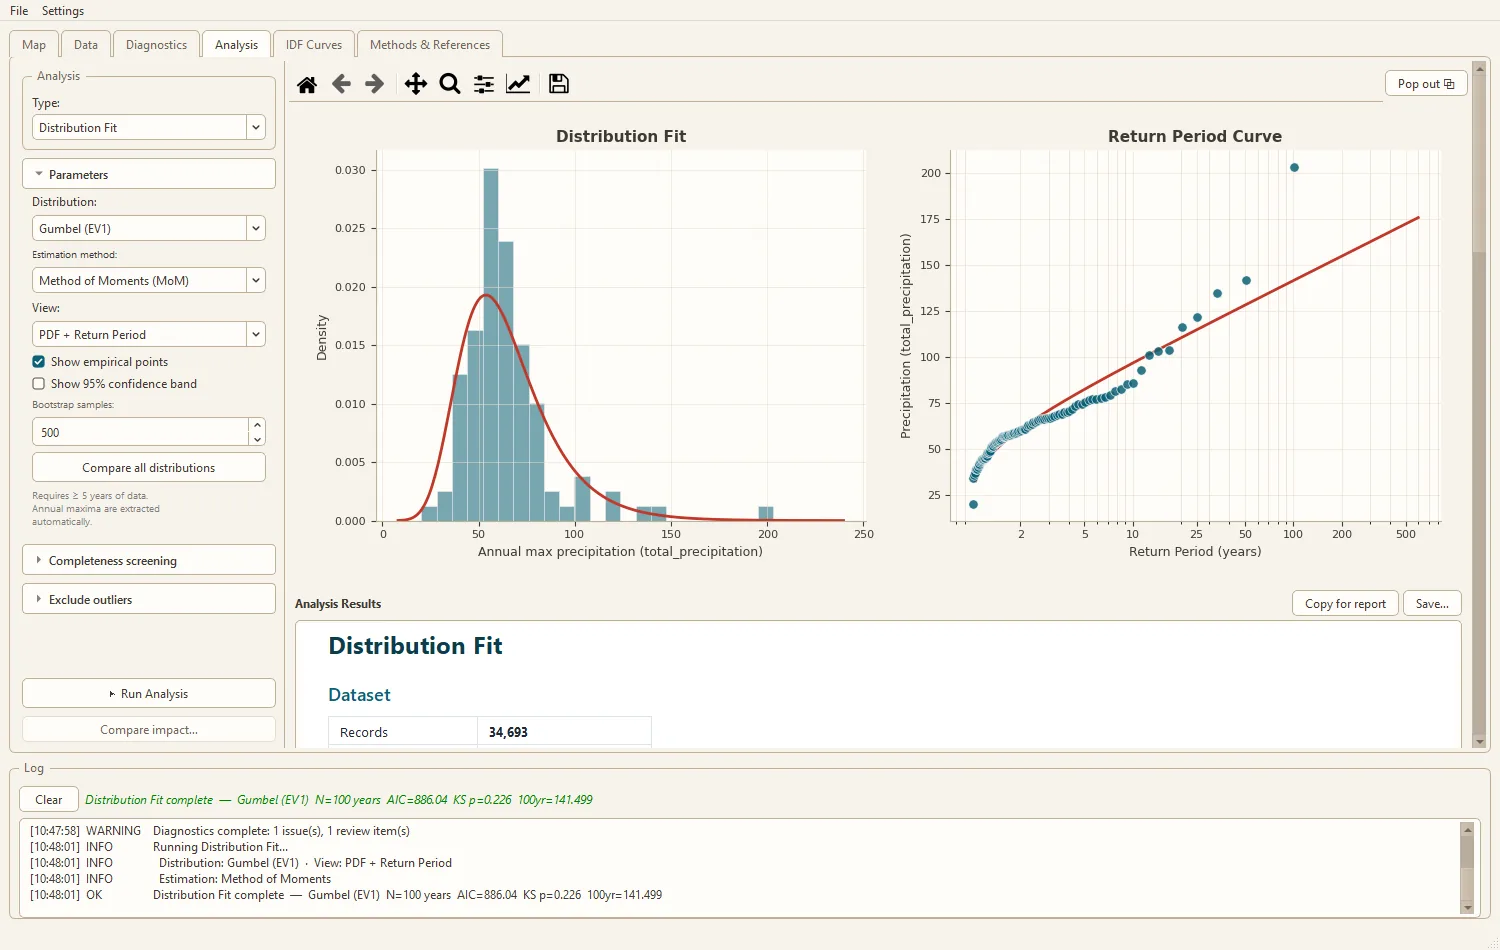
Extreme-value fitting
Gumbel and GEV (L-moments) fits with goodness-of-fit reporting you can defend in review, plus a raw-versus-screened impact comparison so you can see what the screening changed.
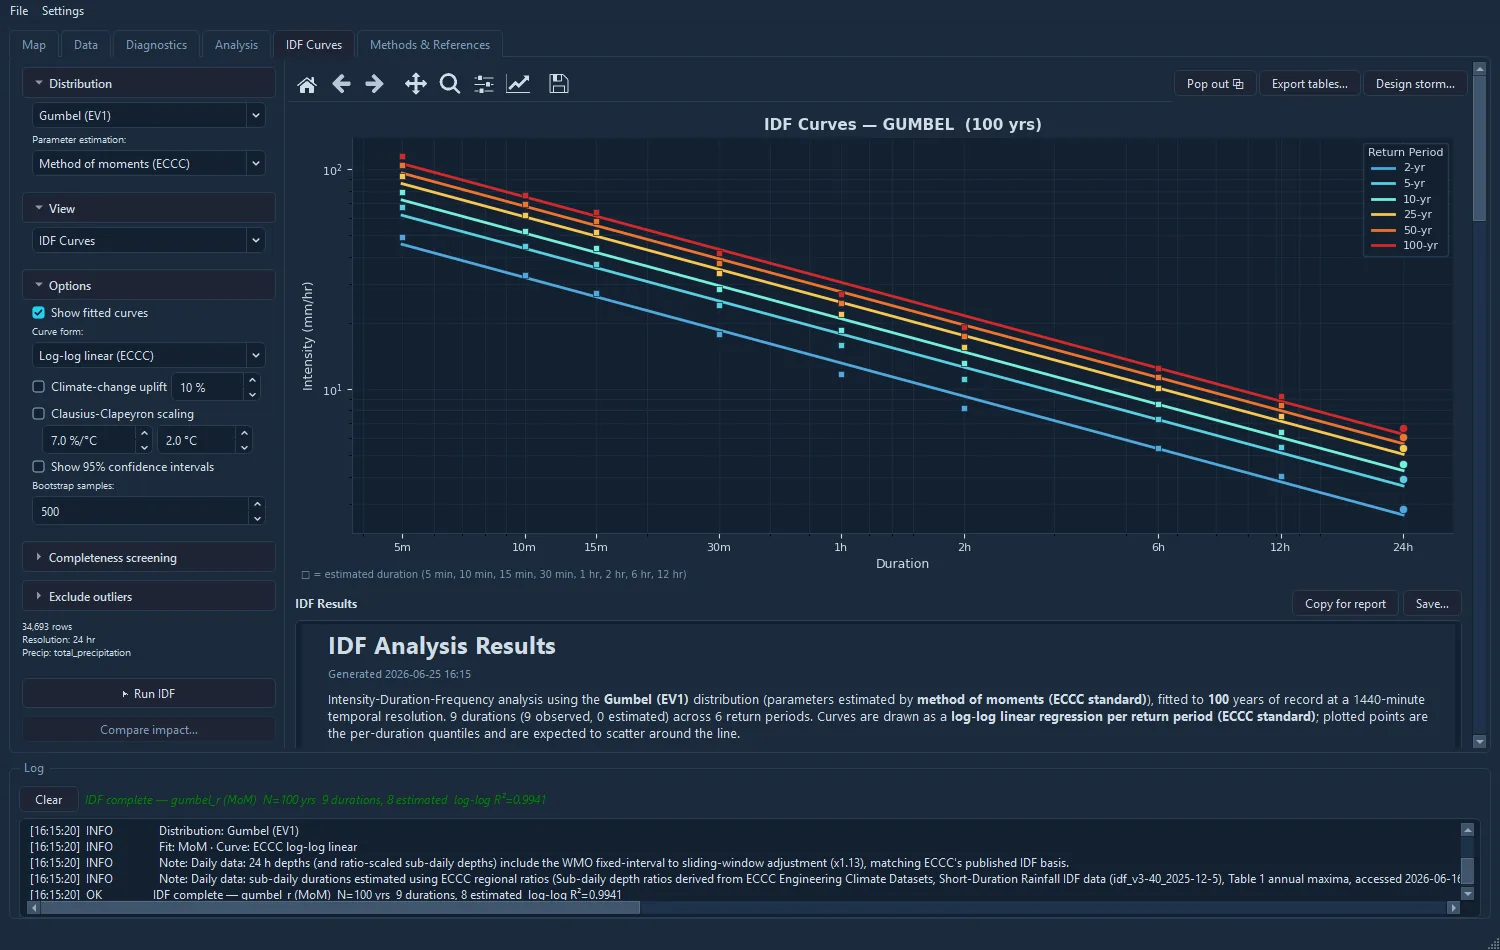
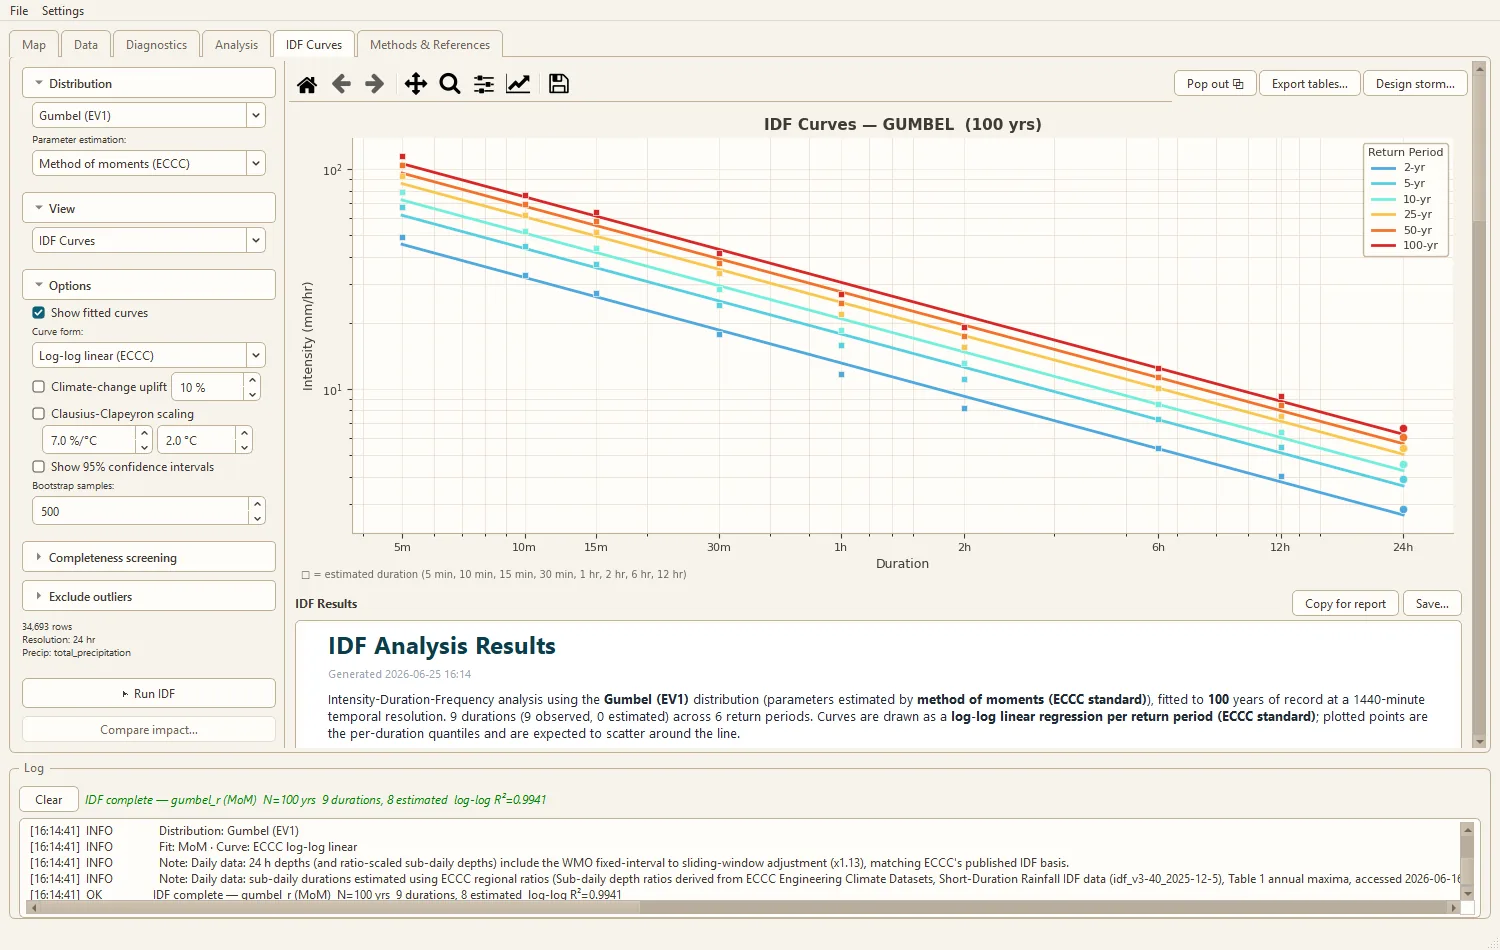
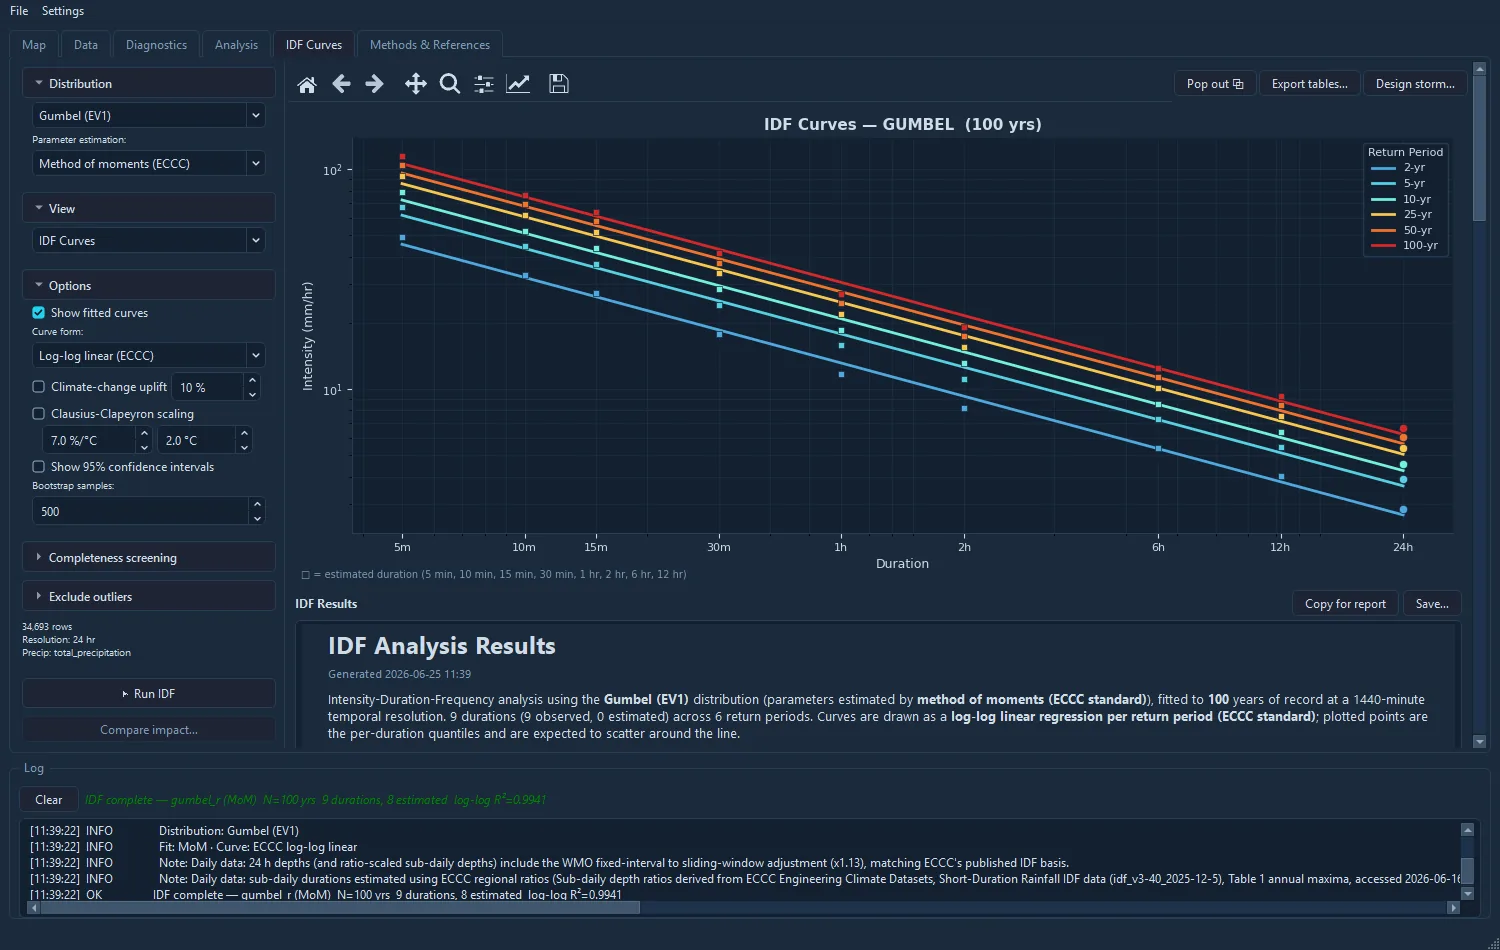
IDF & DDF curves
Log-log intensity and depth curves per return period, with optional 95% bootstrap confidence bands and design storms. Export publication-ready tables to CSV or Excel.
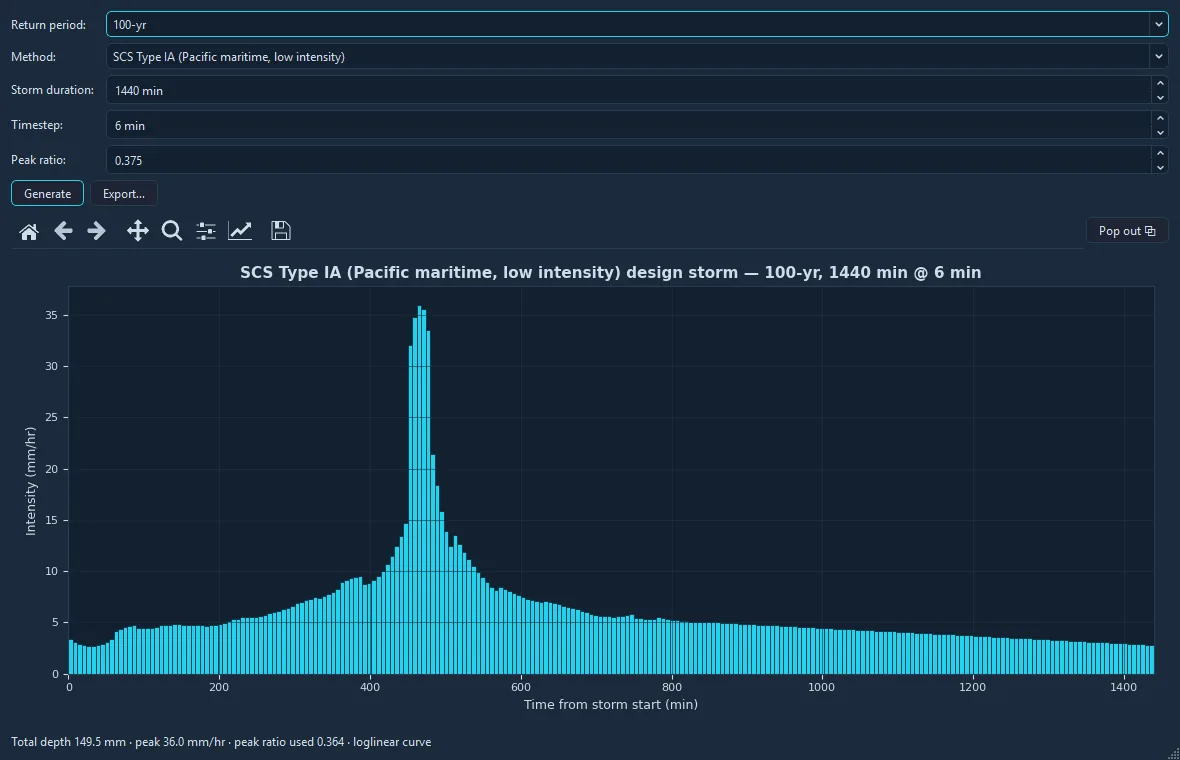
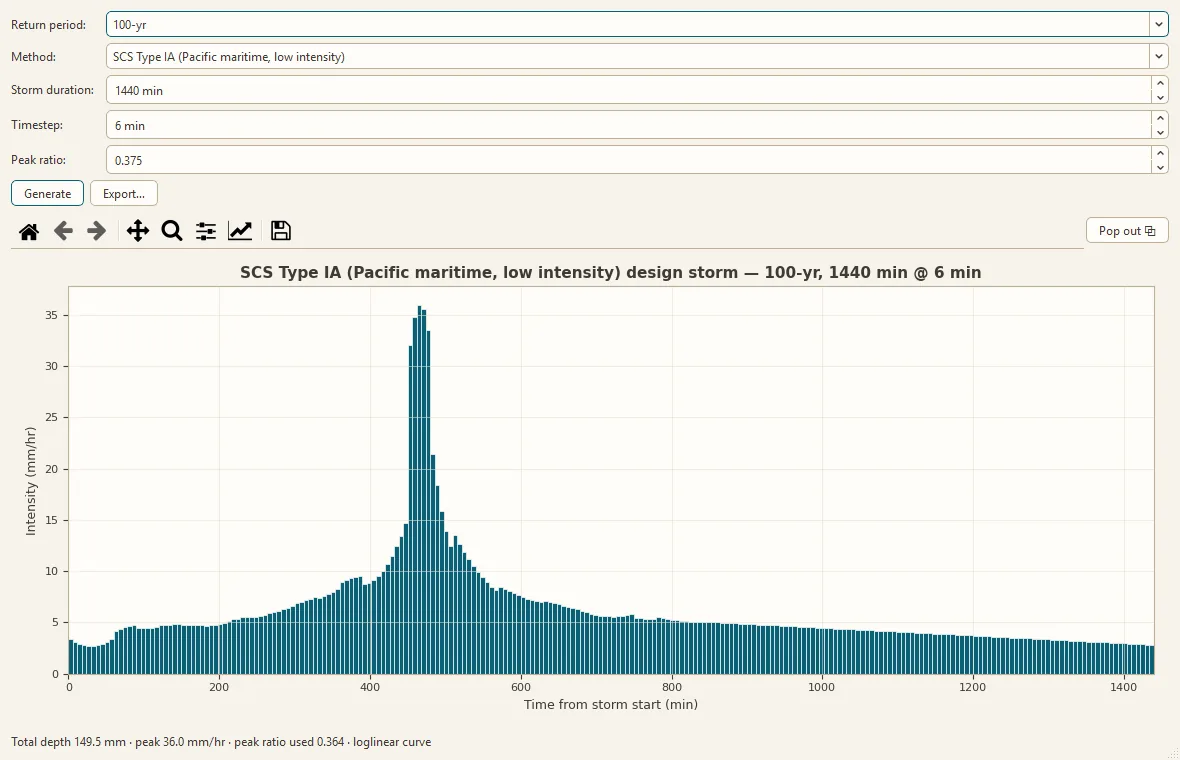
Design storms
Turn the fitted curves into design hyetographs ready to drop into hydraulic and hydrologic models. SCS (NRCS) Type I/IA/II/III mass curves, including the Pacific-maritime Type IA used on the BC coast, plus Chicago and alternating-block. Total depth and peak intensity are reported and exportable.
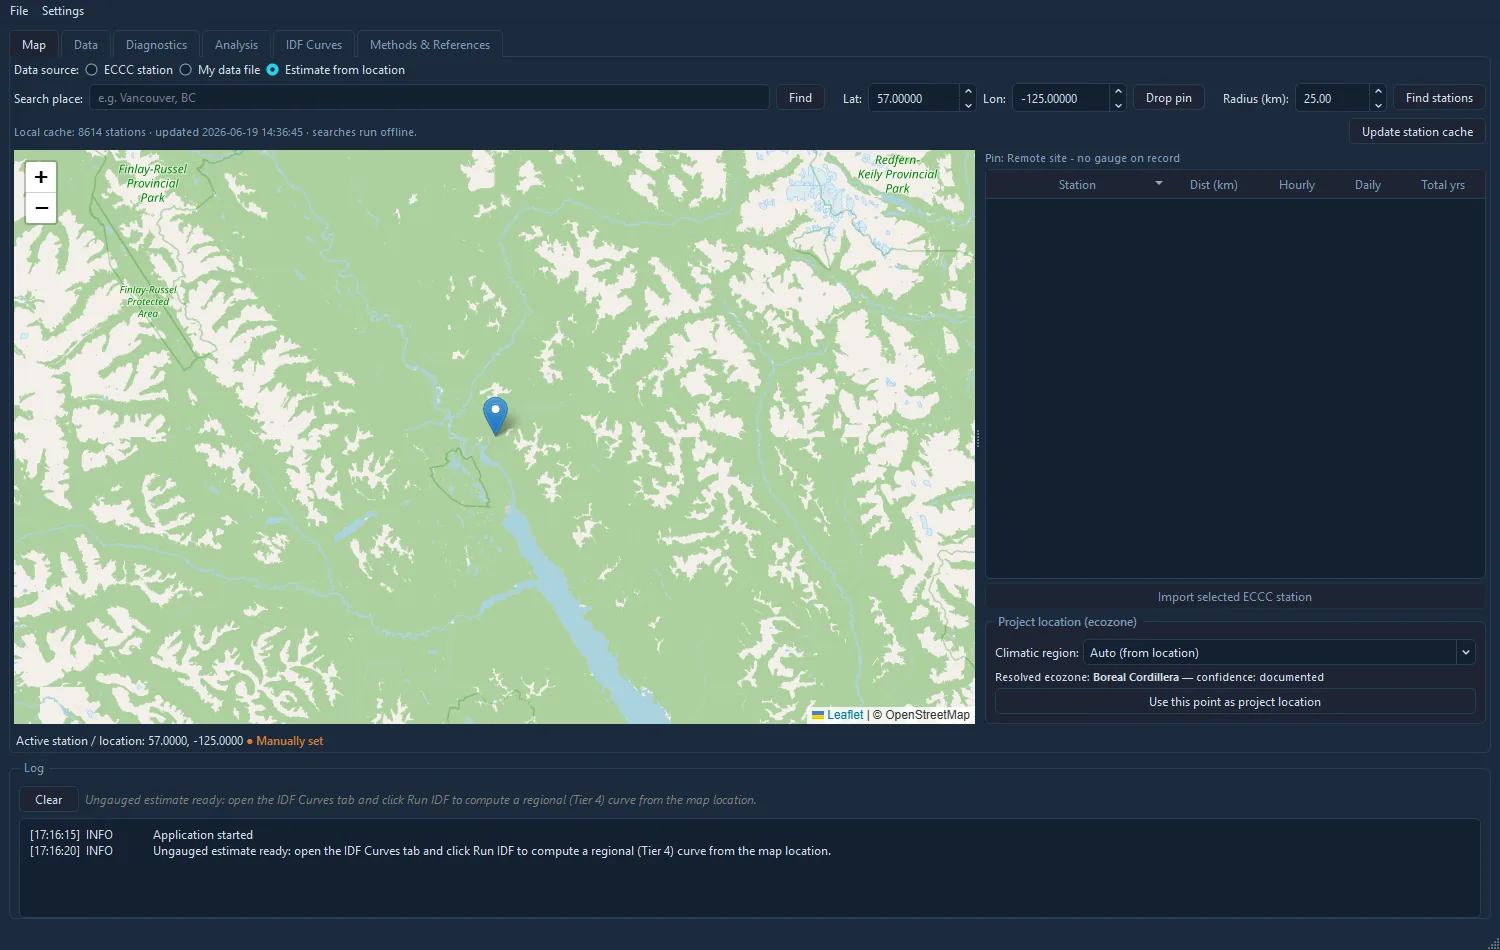
Ungauged estimation
No gauge on site? Drop a pin anywhere on the map and Cascade Hydro builds a full IDF from the location alone, pooling the nearest gauges by index-flood regional frequency analysis (Tier 4). It applies the same sub-daily ratios and reports the basis and nearest-gauge distance.
Sub-daily regionalization
Daily records become sub-daily depths through a continuous region-of-influence ratio surface, distance-weighted from the nearest gauges rather than snapping to a fixed region boundary. Validated nationwide against ECCC's published curves.
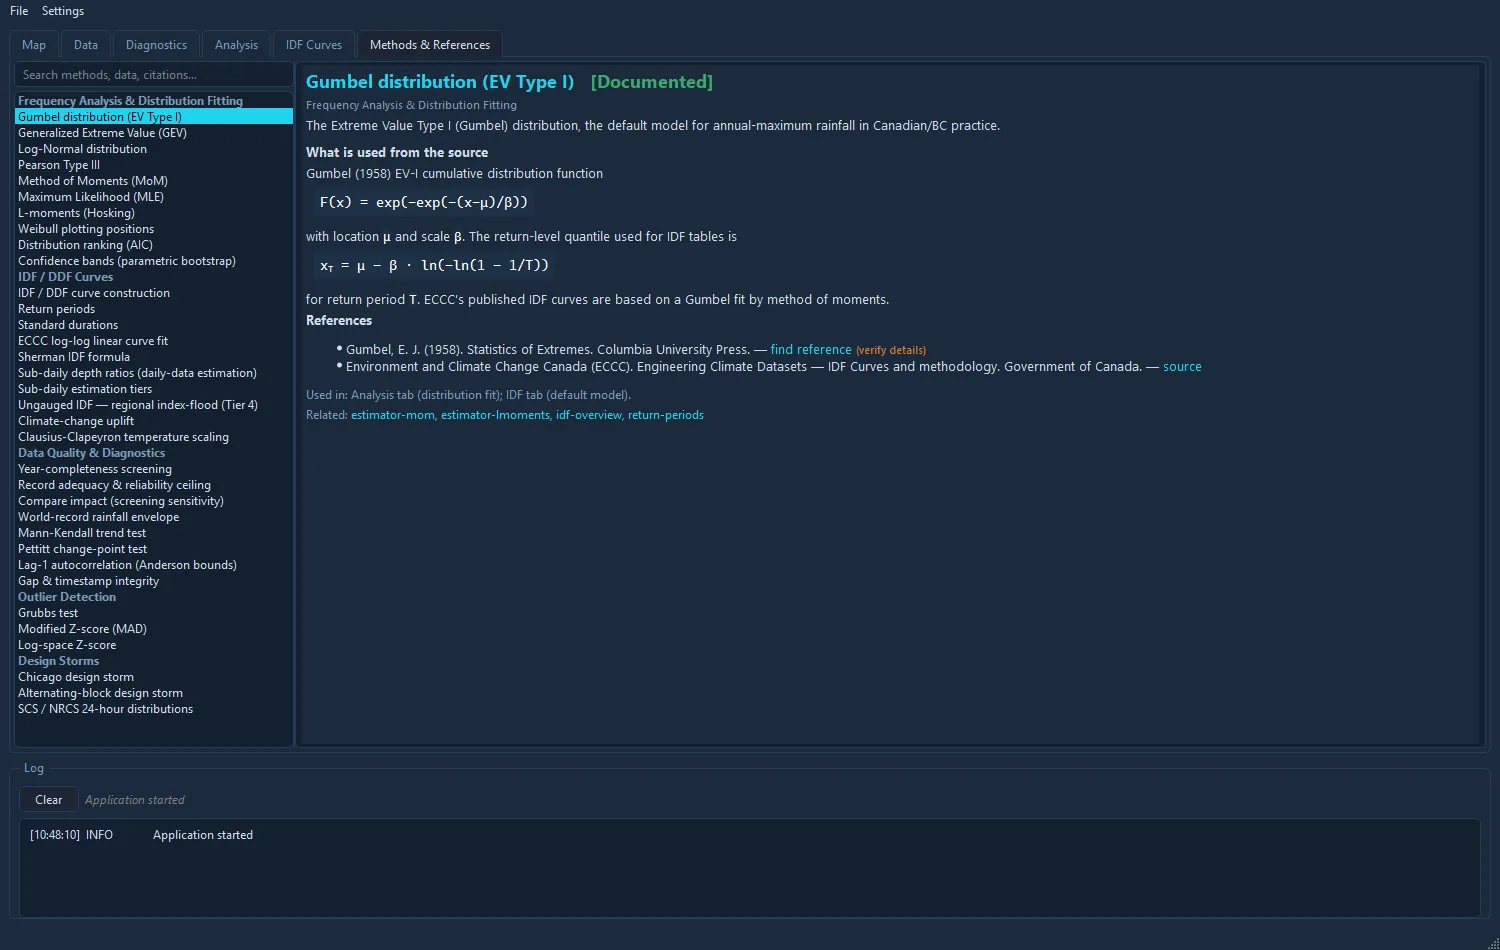
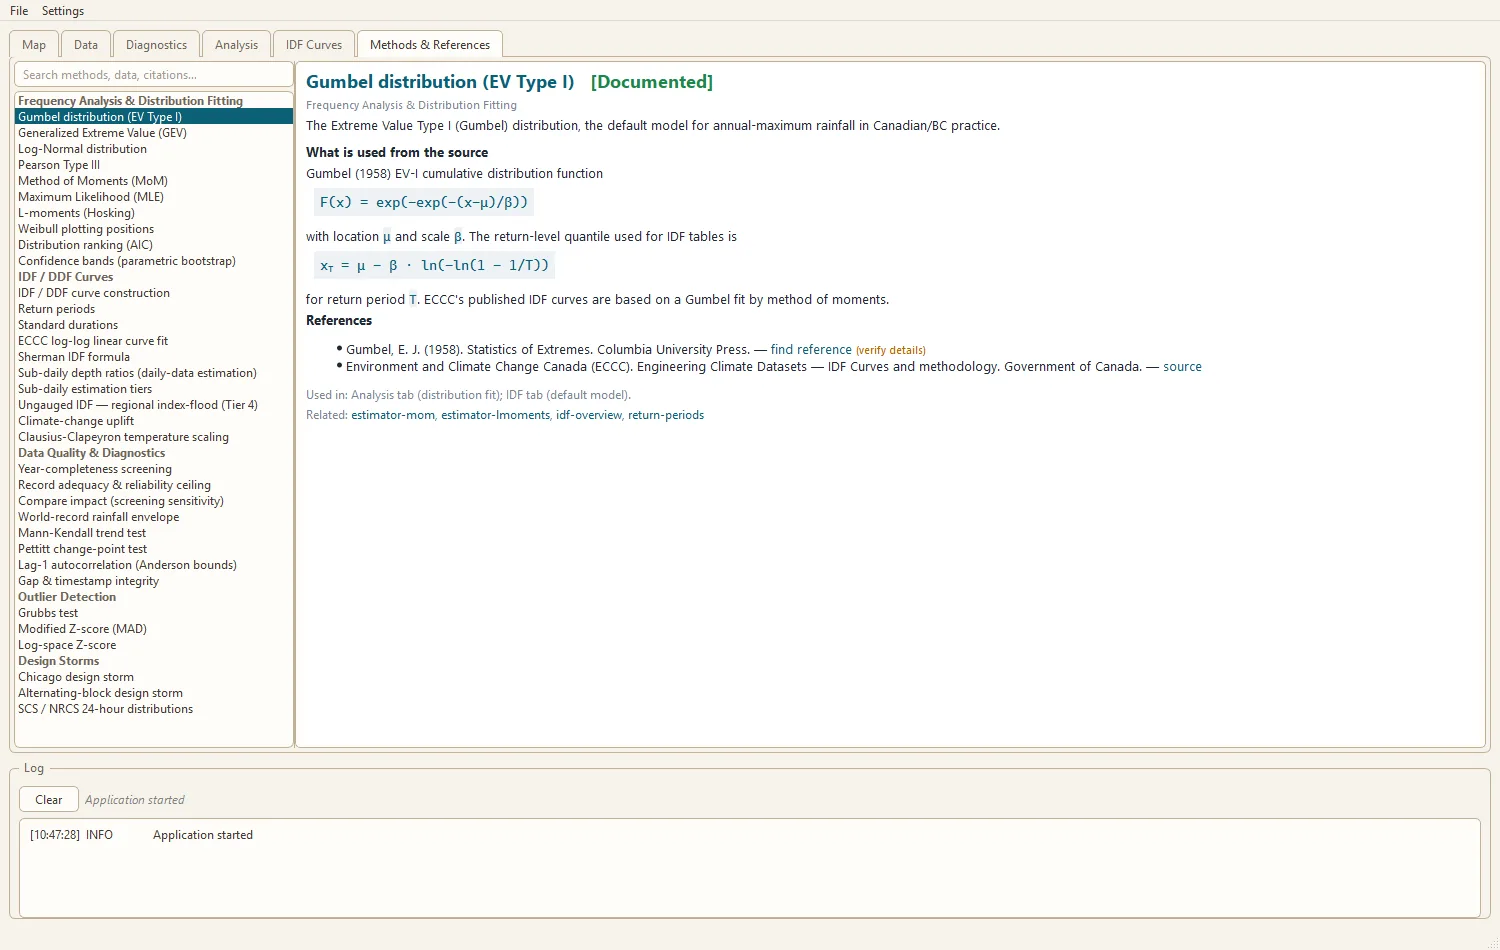
Methods & References
Every method, constant, and citation is surfaced live in the app and deep-linked from each report panel. Nothing in the analysis is a black box.
Validation
Proven against real rain, coast to coast
Every release is checked against published authorities, and tested where there is no gauge at all. Here is the evidence.
Ungauged estimates across Canada
No gauge at your site? Cascade Hydro estimates the curve from the surrounding network. Here every one of 741 ECCC gauges is estimated from its neighbours alone, then compared to its own record. Colour is the size of the miss in millimetres. Hover any station.
Gauged accuracy
Matches the published ECCC curves
On a gauged site, Cascade Hydro reproduces Environment and Climate Change Canada's published return-level depths for Vancouver Harbour CS (1108446) to within about 1%. Every point sits on the 1:1 line, and the same check runs on every release.
See the full validationUngauged accuracy
Close, in the units that matter
Across 741 leave-one-out tests, the typical miss is under 6 mm, and about 82% land within 15 mm of the gauge's own fitted curve. Shown in millimetres, because a few percent on a small storm is only a few millimetres.
Where it varies
Honest about the hard places
Accuracy is not uniform. Dense, low-relief regions are tightest; coastal-mountain regions, where rainfall changes sharply over short distances, vary most. We show it rather than hide it.
How the ungauged method worksLicensing
Built around the individual practitioner
Account-based and consumer-friendly: no machine locks, no passwords, no surprises. Your license belongs to you, not a computer.
Yours on any machine
Account-based, never locked to one computer. Sign in on the office desktop or the field laptop; your license follows you.
Built for working offline
Check in online once, then keep working offline for up to 14 days. No connection needed in the field.
Passwordless sign-in
A magic link, not a password. Nothing for us to leak and nothing for you to remember or reset.
Your data stays local
We store your email, not your work. Precipitation records and project locations never leave your machine.
Cascade Hydro is free during the beta, and signing in is optional. Team and enterprise licensing may come later; for now it's designed around the individual engineer.
Built for hydrologists and stormwater engineers.
Read how each method works, with the equations, constants, and validation against published ECCC curves.